The daily price data for this Sid looks incorrect, it does not match Bloomberg/Yahoo/other sources.
Same with FIBBG009K1K2V4
I don't see any evidence that these sids are wrong. One of these sids is delisted so it would not even be available from a provider like Yahoo. Feedback is welcome but it needs to be more specific and provide better evidence if you are hoping for us to take any action on it.
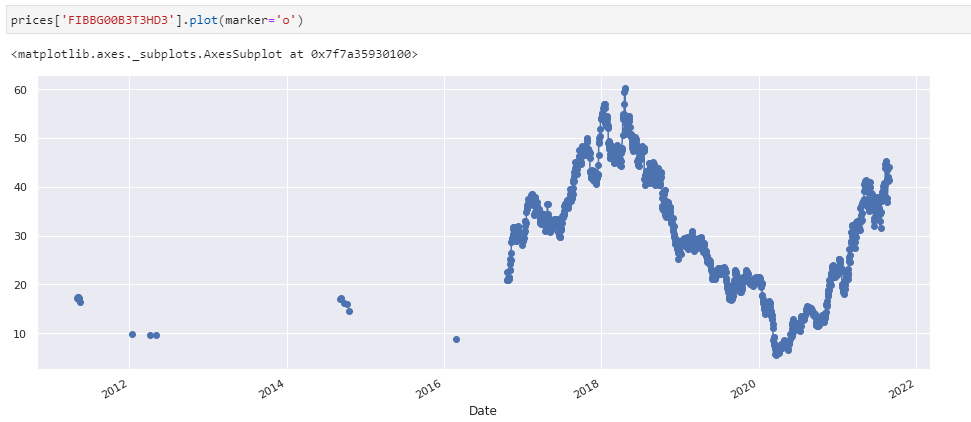
I'll use a different example that might be simpler since it doesn't involve a delisting, Sid = FIBBG00B3T3HD3, name = Alcoa Corp, ticker = AA
This is a plot of the prices since 2010
Bloomberg has no gaps (I get a message saying I can't put two images in my post)
Yahoo has the full data as well (I get a message saying I can't put two images in my post)
Alcoa has a complex corporate history. In 2016, Alcoa Inc (AA) spun off a new company called Alcoa Corp (AA) and the original Alcoa became Arconic (ARCN). ARCN later changed its name to Howmet (HWM). So, the current Alcoa Corp (AA) has only existed since 2016. Some vendors choose to combine the pre-2016 Alcoa Inc time series with the post-2016 Alcoa Corp time series, but based on the details of the corporate spin-off, that’s incorrect. The pre-2016 Alcoa Inc time series should be combined with the post-2016 Arconic (now Howmet) time series, which is what we’ve done. So where other vendors have HWM only back to 2016 and AA going back further, we have AA going back to 2016 and HWM (FIBBG00DYNJGH9) going back to 2007 (the start of our dataset).
This is just one of many examples why you shouldn’t always expect different data vendors to agree. Equities data is highly complex due to a variety of issues, the most significant of which is corporate actions.
That said, the stray data points for Alcoa Corp before 2016 are on a cleanup list and shouldn’t be there.
You can read about the 2016 Alcoa/Arconic corporate event in this press release:
Thanks Brian, this is really helpful.
I'm coming across some other stuff that appears incorrect and causing my backtests to be off, but maybe, like AA, it's not incorrect and I'm missing something. Here is an example:
Sid FIBBG000D2M6H4 - price goes from 12.44 on 2/25/16 down to 2.59 then stays in the 2's until it pops back up to 16.16 on 3/4/2016. This large price swing doesn't appear to occur in other data sources.
If it turns out this is an error in the data, I can send you a list of some other ones I found if you would find that helpful. Thanks.
For this stock, we have a 441584 for 100000 split on 2016-03-04, which is correct and confirmed by other sources. But the unadjusted price series shows a big drop on 2016-02-26 (instead of on 2016-03-04), which seems incorrect and is not confirmed by other sources. Usually when there is an erroneous price jump, the unadjusted prices series is right and there’s an issue with the adjustment, so this case is unusual. We will add this to the QA queue.
Thanks for updating that.
Do you aim to capture the price/volume data if a stock moves to OTC? I noticed some where the data stops, but the usage guide describes having OTC data. One example is Sid FIBBG000LBGTS0, which moved to OTC on 6/25/15 and traded on there until 8/31/16.
Thanks again.
This dataset covers listed stocks only.

